
Austin, Texas · commercial property
Read the Austin market before you sign or buy
Austin built like the boom would never end, and then the office market cooled hard while industrial stayed tight and retail quietly held. This is a plain-spoken look at the four asset classes, the districts that define each, and where the cycle actually stands right now.
Where things stand
A boom market working off its own excess
For a decade Austin was the city everyone was moving to, and developers answered with a wall of new building, office towers downtown, warehouse parks on the edges, and whole mixed-use districts where there used to be surface lots. Then interest rates jumped, the tech hiring wave broke, and a lot of that office space came online into a market that suddenly wanted less of it.
Office oversuppliedIndustrial tightRetail resilientCapital cautious
The result is a split market. Office landlords are competing hard for tenants with concessions and build-outs, while industrial and neighborhood retail have held up far better. Austin’s long-run story, people and companies still arriving, no state income tax, a deep talent pool, hasn’t changed. The near-term job is absorbing what got built. Reading which asset class and which district sits where in that cycle is most of the game, and that is what this site is for.
The lay of the land
Four asset classes, four different stories
Office
The class under the most pressure. A glut of new and sublease space pushed vacancy to modern highs, and the gap between trophy towers that still lease and older buildings that struggle keeps widening. Tenants hold the leverage for now.
Retail
The quiet winner. Austin built relatively little new retail through the boom, so neighborhood centers and street-front space stayed in demand as rooftops multiplied. Grocery-anchored and walkable corridors have held their footing.
Industrial
The tight one. Warehouse, logistics and flex space followed the population and the chipmakers out to the edges of the metro. Even with a construction wave, this class has absorbed space faster than office ever did.
Mixed-use
The format the city now defaults to. The Domain proved North Austin could carry a walkable district of its own, and every major project since blends offices, shops and apartments on one block rather than separating them.
The edges, not the core
Industrial followed the growth out of town
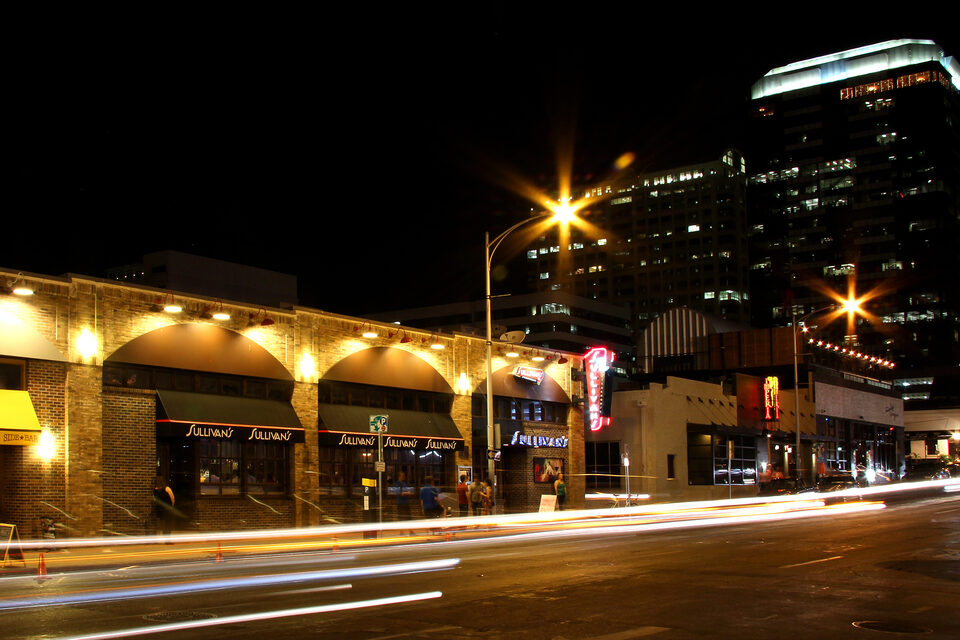
The real estate that is hardest to find in Austin right now isn’t a downtown office floor, it’s a clean warehouse near a highway. As chip plants, distribution and light manufacturing landed around the metro, the demand for logistics and flex space outran the supply of it, and the old warehouse pockets near downtown turned into some of the city’s most coveted adaptive-reuse ground.
The resilient class
Retail quietly did better than anyone expected
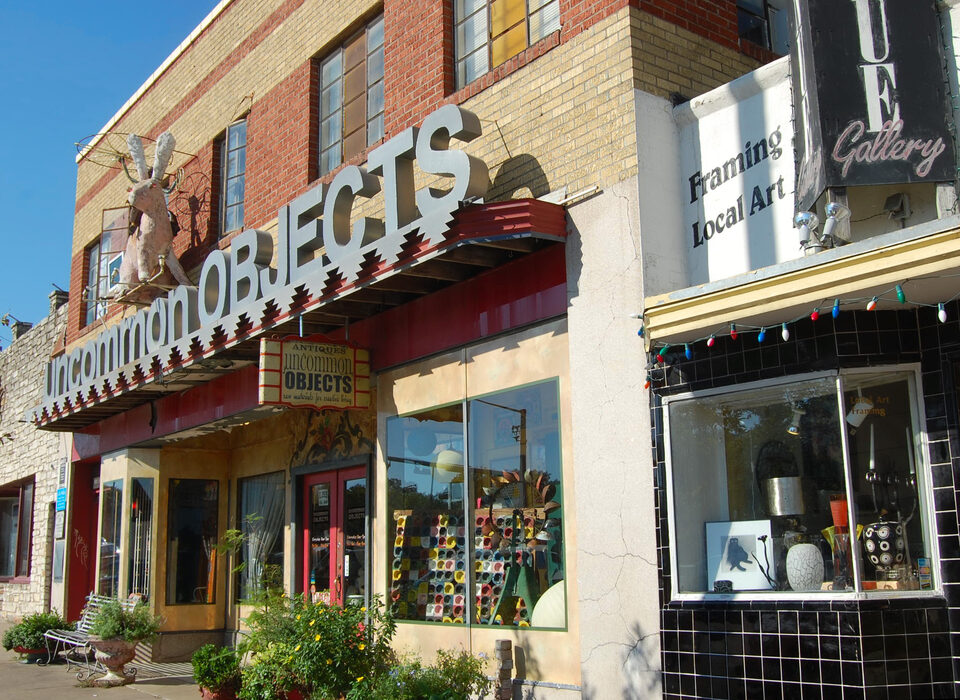
Street-front retail was supposed to be the casualty of online shopping. In Austin it became an amenity instead. South Congress, East Sixth, the Mueller town center and dozens of neighborhood strips lease on the foot traffic the boom delivered, and well-placed space rarely sits empty for long. The weak spots are the oversized, car-first centers, not the walkable ones.
Before you commit capital
What to weigh as an owner or tenant
A split market rewards knowing which lever you are actually pulling. Four places to dig into the numbers.
Cap rates & the math
How Texas property taxes, 1031 exchanges and a higher-rate environment reshape what a deal pencils to in Austin.
NNN, gross & TI
Triple-net versus gross, tenant-improvement allowances, CAM charges, the clauses that decide what you really pay.
Submarkets
Downtown, the Domain, East Austin, the airport corridor and the boom belt each run on their own clock. Where each one sits.
Market news
Absorption, deliveries, big relocations and the policy fights that move them, tracked as they happen.
From the news desk
Latest on the Austin market
We follow office absorption, industrial deliveries, and the districts in motion so you don’t have to.

The format of the next cycle
Start with how the market works
Asset classes, districts, and the honest trade-offs, in one place, kept current. Begin with the questions owners and tenants ask first.